 Investing can feel like navigating a maze blindfolded. With thousands of stocks to choose from and each company producing a mountain of data, even seasoned investors can feel overwhelmed. To cut through the noise, many platforms now offer quant ratings and algorithmic scoring tools. These systems use mathematics and vast datasets to condense complex information into simple, easy-to-understand grades.
In this article, we’ll explain how quant ratings work, why they’ve become popular, and how you can use them to make more informed stock selections. We’ll also compare different scoring models, discuss their benefits and limitations, and explore how these tools are evolving.
What is Quantitative Analysis?
To understand quant ratings, we must first start with quantitative analysis. In finance, “quant” analysis uses mathematics and statistics to determine an asset’s value. As Investopedia explains, quant analysts use data—from historical prices to financial statements—to build models that inform trading strategies.
The core goal is simple: use quantifiable statistics to support profitable decisions. This means letting the numbers guide the process, using computer models to identify patterns and optimal entry or exit points.
This data-driven approach contrasts with qualitative analysis, which focuses on non-statistical factors like management quality, brand strength, and industry trends. Advances in computing power have made processing huge datasets quick and efficient, pushing quantitative methods into the mainstream.
How Quant Ratings Work
Quant ratings take this analysis a step further by scoring individual stocks against multiple factors. A well-known example is Seeking Alpha’s quant rating system. According to their help center, it’s an objective evaluation based on data from financial statements, price performance, and analyst estimates.
The system compares over one hundred metrics for each stock against its sector peers. Each stock receives a numeric score from 1.0 (Strong Sell) to 5.0 (Strong Buy), plus letter grades (A+ to F) for five key pillars:
Value
Growth
Profitability
Momentum
EPS Revisions
These factor grades are rolled into the overall score. A stock excelling in value, growth, and profitability, with positive earnings revisions and strong momentum, will likely earn a high quant rating. Conversely, low scores across these areas typically lead to a Hold or Sell recommendation.
Why Use Quant Ratings?
 Quant ratings aim to remove emotion and bias from investing. By relying on data rather than opinion, they can help identify opportunities and highlight risks. Since ratings update frequently—often daily—they can alert you to meaningful changes in a stock’s fundamentals or momentum.
For many investors, the simplicity of a single score or a report-card style breakdown is a huge time-saver. However, it’s crucial to remember that quant ratings are a supplement to your own research, not a replacement for it.
Main Development and Trends
The Rise of Algorithmic Scoring
The explosion of big data and the growth of retail investing have fueled demand for tools that simplify analysis. As the Ziggma blog notes, these algorithms “simplify complexity by condensing vast amounts of data into a single score or rating.” In an era of information overload, a clear, objective signal can save time and reduce stress.
Different platforms cater to different investing philosophies:
Seeking Alpha’s Quant Rating: Blends short- and long-term analysis across the five pillars.
Zacks Rank: Focuses heavily on earnings estimate revisions and surprises, ranking stocks from 1 (Strong Buy) to 5 (Strong Sell).
Ziggma: Uses a multi-factor model for medium- to long-term investors, scoring stocks from 0 to 100.
Morningstar: Employs a 1-5 star rating based on discounted cash-flow models, appealing to long-term value investors.
The common thread is the use of algorithms to process vast amounts of information and present it in a user-friendly format.
Evidence of Performance
Do these ratings actually work? Backtesting provides some compelling evidence. A review of Seeking Alpha’s system found that its Strong Buy-rated stocks have historically outperformed the market, while Strong Sell stocks have underperformed. The system is also noted for being quick to downgrade stocks, which can help investors avoid steep losses.
While past performance never guarantees future results, this data suggests algorithmic scoring can add real value. This success has encouraged a wave of proprietary models from robo-advisors and brokerages, with machine learning poised to create even more sophisticated tools.
Real-World Application
Using Quant Ratings in Practice
So, how can you integrate these tools into your process? Here are practical steps:
Screen for Ideas: Use a stock screener to filter for companies with high quant scores (e.g., a minimum of 4.0 or “Buy”) and strong grades in factors you care about, like Value and Growth.
Dig into the Factors: Don’t just look at the overall score. A stock with an “A” in Growth but a “C” in Value tells a specific story. Understanding the “why” behind the score is critical.
Compare Across Platforms: If a stock is a Strong Buy on Seeking Alpha, has a high score on Ziggma, and sports 5 stars from Morningstar, your conviction can grow. Conflicting scores are a signal to dig deeper.
Watch for Changes: Regular rating updates are a key feature. A downgrade from Buy to Hold can be an early warning of deteriorating fundamentals.
Use with Caution: Algorithms rely on historical data and can miss qualitative shifts like a management scandal or a breakthrough product. Always supplement scores with your own research.
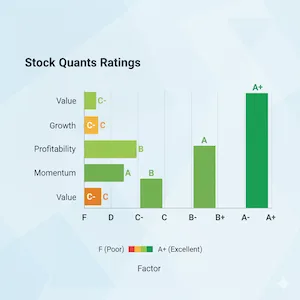
Understanding a Factor Breakdown
 The overall quant score is a summary, but the real insight comes from digging into the individual factor grades. This helps you understand the why behind a rating. A stock can have weak spots in one area but be strong enough in others to still warrant a “Buy.”
The table below shows a hypothetical example of how a stock might be graded across the five key pillars. This illustrates how the factors combine to create the final score.
| Factor | Importance (Hypothetical Equal Weighting) | Example Grade |
|---|---|---|
| Value | 20% | C- |
| Growth | 20% | A+ |
| Profitability | 20% | B |
| Momentum | 20% | A |
| EPS Revisions | 20% | B+ |
| Overall Rating: BUY |
Note: The “Importance” column uses a simplified, equal weighting for illustration. In practice, quant models use proprietary weightings where some factors may carry more influence than others.
As this example shows, a stock with a below-average Value score can still achieve an overall “Buy” rating if it demonstrates exceptional strength in Growth and Momentum. This highlights why analyzing the component grades is essential—it allows you to see the stock’s specific strengths and weaknesses and decide if its profile aligns with your investment strategy.
Pros and Cons
Benefits:
Objectivity: Reduces emotional and cognitive bias by relying on data.
Speed & Efficiency: Processes more information than any human could, updating in real-time.
Comparability: Makes it easy to compare companies within the same sector.
Limitations:
Opaque Weighting: The exact formula and factor weights are often proprietary, so you don’t know what’s driving the score most.
Historical Bias: Models are built on past data and may fail during unprecedented market events.
Lack of Qualitative Insight: They ignore crucial factors like corporate culture, regulatory risks, and management expertise.
Because of these trade-offs, quant ratings are most powerful when used as one tool in a broader toolkit that includes fundamental and qualitative analysis.
Future Outlook and Implications
Algorithmic scoring is continuously evolving. As artificial intelligence advances, we can expect more adaptive and nuanced models. Future systems may incorporate alternative data—like social media sentiment or satellite imagery—and better integrate ESG (Environmental, Social, and Governance) metrics.
A key challenge will be balancing complexity with transparency. Investors need to understand what drives a score to trust it. Regulators may also increase scrutiny to ensure fairness. Ultimately, while quant ratings will become more sophisticated, they are unlikely to fully replace the critical thinking and judgment of a thoughtful investor.
Final Thoughts
Quant ratings and algorithmic scoring models are powerful guides for navigating the stock market. By transforming immense datasets into simple scores, they help investors spot opportunities and avoid pitfalls. Systems like Seeking Alpha’s—built on Value, Growth, Profitability, Momentum, and EPS Revisions—have demonstrated their value through historical performance.
However, no algorithm is infallible. Use these tools as a starting point for your research, not the final word. Combine them with reading annual reports, listening to earnings calls, and considering qualitative factors. By marrying data-driven insights with your own knowledge and risk tolerance, you can simplify stock selection without sacrificing the art of investing.
References
Seeking Alpha – “What Are Quant Ratings, and How Do I Use Them?”
Ziggma – “Stock Scoring Compared: Ziggma vs. Zacks, Seeking Alpha and Morningstar.”
Wall Street Survivor – “Seeking Alpha’s Quant Rating System Review.”
Investopedia – “A Simple Overview of Quantitative Analysis.”